How To Debug Javascript (A Beginners Step By Step Tutorial)
Posted by The Curious Website Designer | Posted on Sun 20 Mar 2016

I used to hate Javascript. With a passion!
Don't get me wrong, it can be really useful to be able to undertake some programatic tasks without having to go back to the server and reload the whole page, but when there is an error in the code it just does nothing - there's no error message; nothing to tell you what's wrong or where to start looking. At least with PHP, it usually tell you what's gone wrong and more importantly on what line !
Googling 'how to debug javascript' gave me a results set that was full of forum enquiries that just pointed people to using Chrome or Firefox 'Developer Tools', and 'you'll find the answer in the 'Console'. When I eventually worked out what the 'Developer Tools' were, it felt like being given control of the space shuttle and told to 'get on with it' !
So, here's a simple guide to get those of you who are just getting to know a little about javascript but aren't sure how to debug the script when things go wrong.
To start the tutorial I have a simple example script (click here for the sample page) - There are two buttons which should provide a popup alert when clicked. You will see that only one of them does. There is no indication as to why this might be happening.
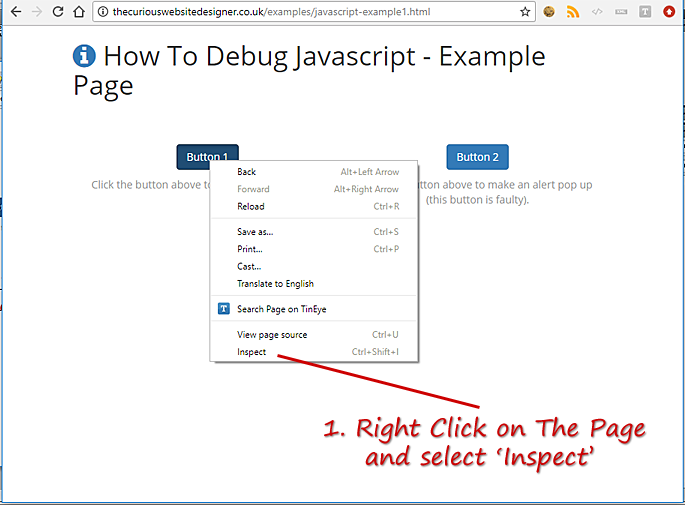
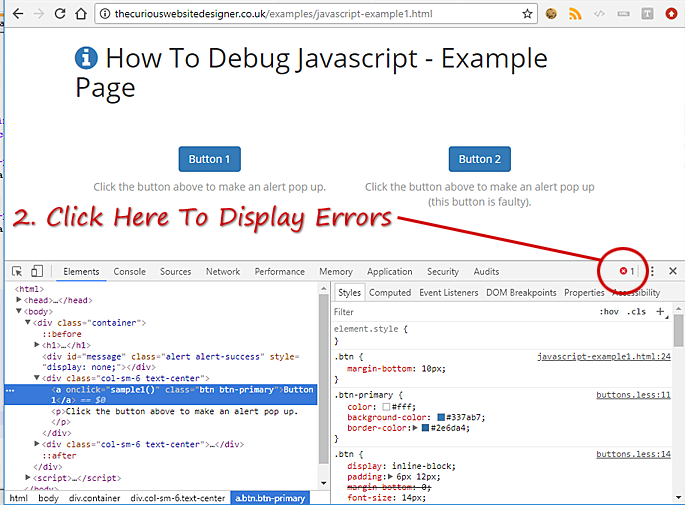
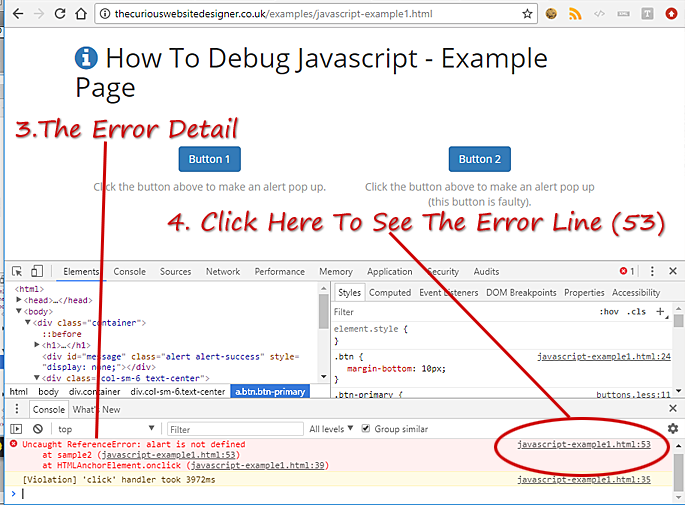
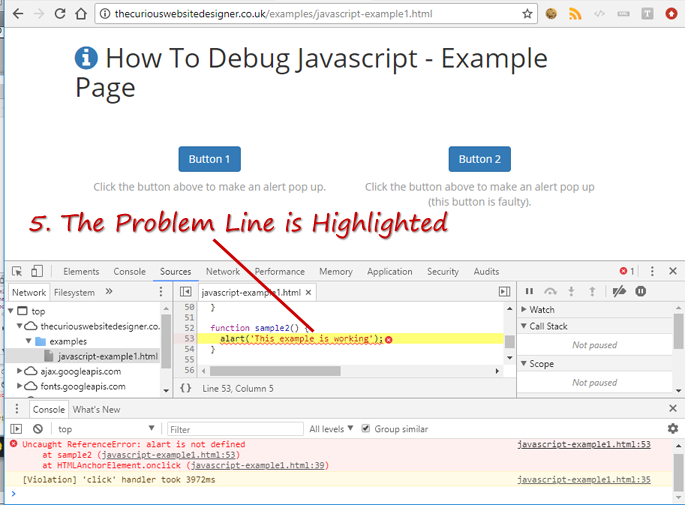
Follow the guide below to discover what the problem is (Please note this guide works with Google Chrome - the process is similar [but not exactly the same] with Firefox. This facility is not available with IE or Safari):


As you can see the problem is with the javascript function 'sample2()' - alert is misspelled.
There is much more that the developer tools app can help you with. Watch out for further features in the future.
Tags: javascript, debugging, debug tools, debug javascript
